Example Notebook: Atom Mappings#
In this example we want to showcase how to generate the Kartograf mappings on the RHFE Data set, which was used for our publication.
Get Data:#
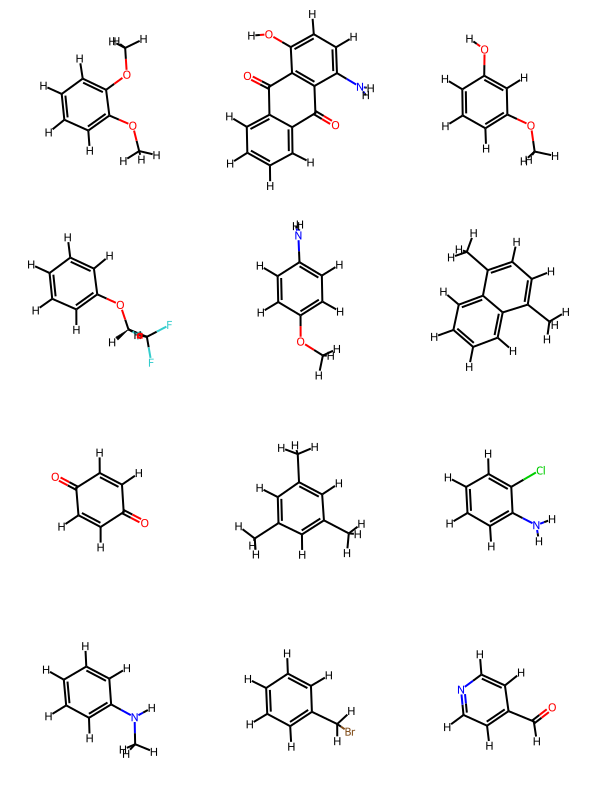
In this cell we will load the molecules as components from openfe-benchmarks. Note, that openfe-benchmarks contains aligned molecules with 3D coordinates. It is a general assumption for Kartografs atom mapper to get input molecules with well aligned conformations.
[8]:
import tarfile

from gufe import SmallMoleculeComponent
from rdkit import Chem

components = []
with tarfile.open("benzenes.tar.gz", mode="r:gz") as tar:
    for member in tar:
        with tar.extractfile(member) as f:
            mol = SmallMoleculeComponent.from_msgpack(content=f.read())
            components.append(mol)

Chem.Draw.MolsToGridImage([c.to_rdkit() for c in components])
[8]:
Generate Atom Mappings with Kartograf:#
Next we will generate all possible atom mappings, for the given Ligand cA. These mappings will be visualized in 3D in the latter cell.
[9]:
from kartograf import KartografAtomMapper

atomMapper = KartografAtomMapper()

# Generate Mappings
mappings = []
cA = components[-5]  # central ligand from Ries et al. 2022
for cB in components:
    if cA != cB:
        mapping = next(atomMapper.suggest_mappings(cA, cB))
        mappings.append(mapping)
[10]:
from gufe.visualization.mapping_visualization import display_mappings_3d

display_mappings_3d(mappings)
[10]:
Scoring Metrics for Atom mappings:#
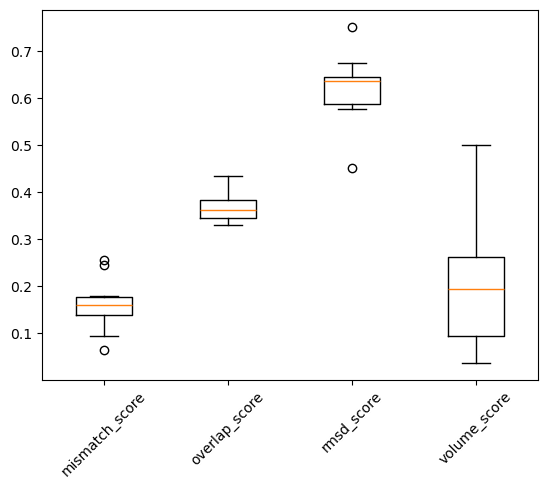
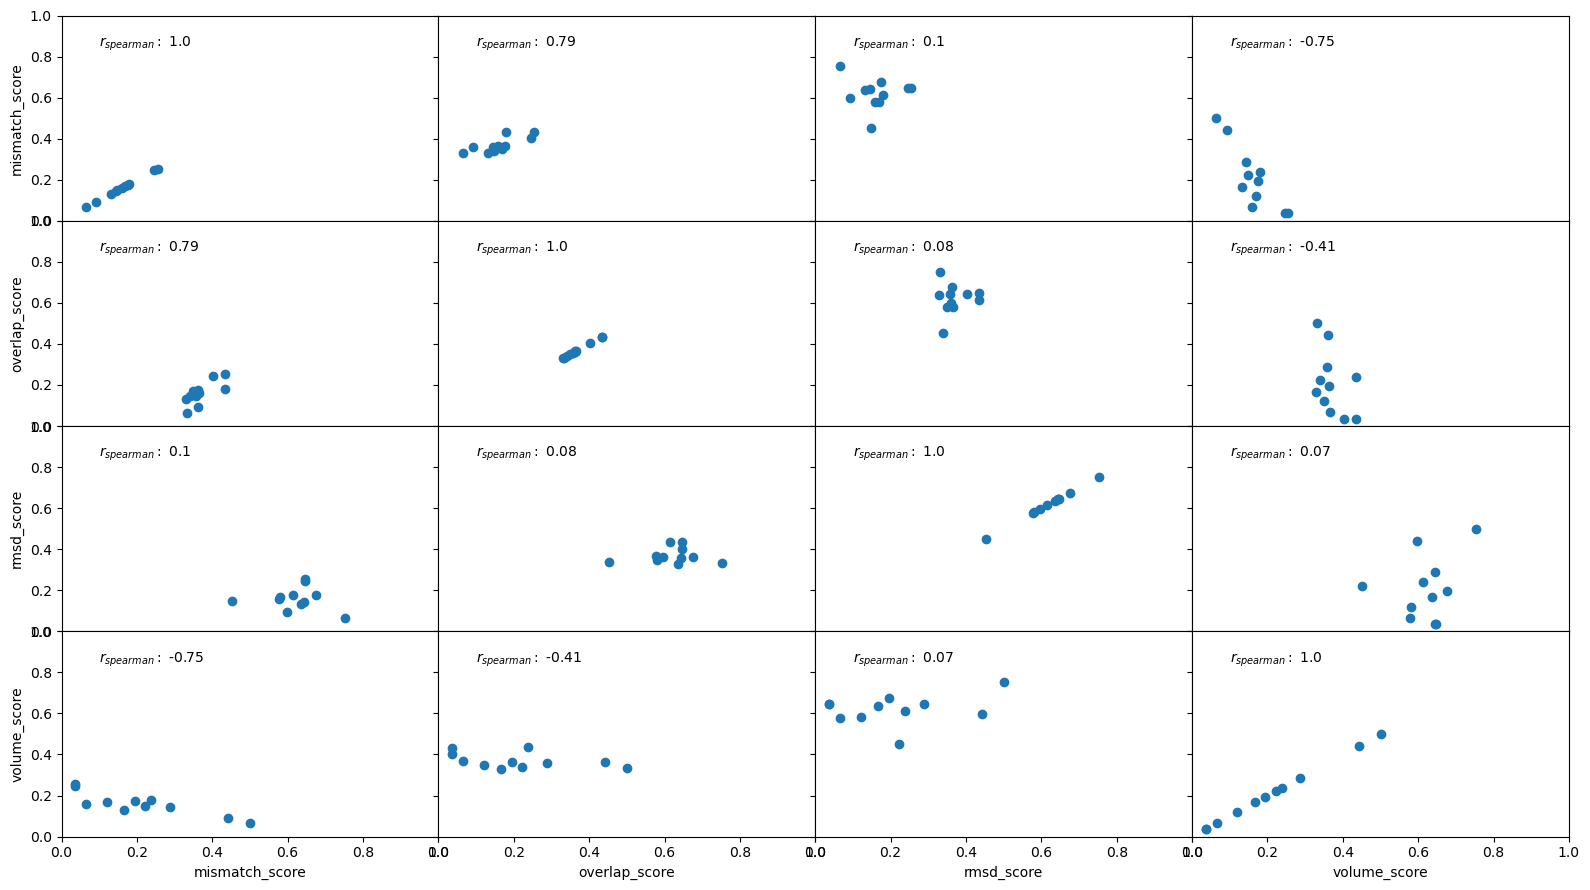
Finally we want to compare the different mappings with rule-based scoring metrics. This way for example we can try to estimate the complexity of the transformation from cA to cB.
[11]:
from kartograf.mapping_metrics import (
    MappingRMSDScorer,
    MappingShapeMismatchScorer,
    MappingShapeOverlapScorer,
    MappingVolumeRatioScorer,
)

scorer_dict = {
    "volume_score": MappingVolumeRatioScorer(),
    "rmsd_score": MappingRMSDScorer(),
    "overlap_score": MappingShapeOverlapScorer(),
    "mismatch_score": MappingShapeMismatchScorer(),
}


def apply_scorers(mapping) -> None:
    for score_name, scorer in scorer_dict.items():
        setattr(mapping, score_name, scorer(mapping))


# score mappings:
for mapping in mappings:
    apply_scorers(mapping)
[12]:
from matplotlib import pyplot as plt

score_names = sorted(scorer_dict)
plt.boxplot([[getattr(m, score_name) for m in mappings] for score_name in score_names])
plt.xticks(range(1, len(score_names) + 1), score_names, rotation=45)
[12]:
([<matplotlib.axis.XTick at 0x73a320a19f90>,
  <matplotlib.axis.XTick at 0x73a3209d65d0>,
  <matplotlib.axis.XTick at 0x73a3209d6e90>,
  <matplotlib.axis.XTick at 0x73a3209d7610>],
 [Text(1, 0, 'mismatch_score'),
  Text(2, 0, 'overlap_score'),
  Text(3, 0, 'rmsd_score'),
  Text(4, 0, 'volume_score')])
[13]:
from matplotlib import pyplot as plt
from scipy.stats import spearmanr

score_names = sorted(scorer_dict)
fig, axes = plt.subplots(nrows=len(score_names), ncols=len(score_names), figsize=[16, 9])

i = 0
for score_nameA in score_names:
    j = 0
    axes[i, j].set_ylabel(score_nameA)

    for score_nameB in score_names:
        ax = axes[i, j]
        if i == len(score_names) - 1:
            ax.set_xlabel(score_nameB)
        else:
            ax.set_xticklabels([])
        if j > 0:
            ax.set_yticklabels([])

        x = [getattr(m, score_nameA) for m in mappings]
        y = [getattr(m, score_nameB) for m in mappings]
        r, _ = spearmanr(x, y)
        ax.scatter(x, y)
        ax.text(0.1, 0.85, "$r_{spearman}:~$" + str(round(r, 2)))
        ax.set_xlim([0, 1])
        ax.set_ylim([0, 1])

        j += 1
    i += 1
fig.tight_layout()
fig.subplots_adjust(wspace=0, hspace=0)
[ ]: